Our flagship competitive intelligence product, Competitor Analytics, sets the standard within the investment banking and financial services sector for performance and efficiency measurement across Equities Sales & Trading, FICC Sales & Trading, Origination, Advisory, Transaction Banking, Lending, and Securities Services.

Competitor Analytics equip and enable our clients to understand their competitive landscape and make informed strategic decisions. The analytics cover:
- The largest 15 global Investment Banks for 90+ products across Origination & Advisory, Equities Sales & Trading and FICC Sales & Trading and five regions
- The largest 10 Transaction Banks for 15+ products across Cash Management, Trade Finance and Securities Services and four regions
Our Competitor Analytics product includes:
Revenues
Performance Benchmarking
- Named, quarterly analysis of revenues, headcount and productivity
- Like-for-like benchmarking of performance through accounting/organisation adjustments
- Output customisation to reflect each Bank’s business model and product taxonomy
- Intelligence across all regions and products, highlighting outperformance and underperformance
- Bespoke deep dive projects with granular insight into a product and/or country
Organizational Insight
- Market trends and strategic insight related to business structure and client franchise
- Business structures including reporting hierarchies and coverage models
- Identification of executive management and business heads
Resources
Model Assessment
- Comparison of RWA requirements for VaR, S-VaR, CVA, and IRC
- Comparison of RWA requirements for counterparty credit
- Identification of executive management and business heads
Risk Assessment
- Benchmarking of actual RWA by business
- Benchmarking of normalized RWA by business
Productivity Assessment
- Revenues / normalised RWA, i.e. how much revenue generated per unit of risk taken
Benefits
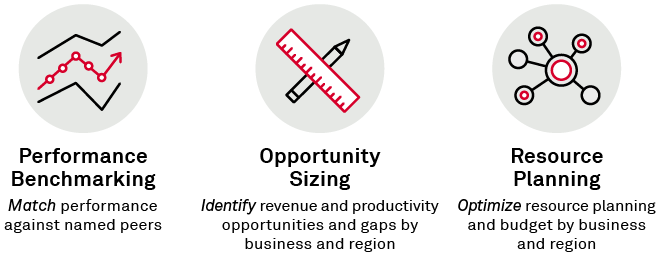
Benchmark Performance
- Against named peers
- On a quarterly basis matching strategy, planning and compensation cycles
- On a like-for-like basis and to a Bank’s own business structure
Size the Leads and Gaps
- Revenue opportunities / threats by business
- Revenue opportunities / threats by region
- Productivity outperformance / underperformance
Support Budget / Resource Planning
- Resource budget planning by business and by region
- Headcount allocation to optimise resources
- Compensation analysis by business and by region
